Shelter Access Blueprint
Why the journey restarts every morning
- Role
- Service Designer & Information Designer — evidence synthesis, ecosystem mapping, service blueprint, and opportunity framing
- Status
- Service design study
- Timeline
- 2026
- Methods
- Desk research · scenario evidence synthesis · ecosystem mapping · current-state service blueprint
- What changed
- A fragmented public-service problem became one traceable model linking human consequences to operational causes
The central design decision was to map shelter access as a repeating service loop rather than a linear intake flow. That made visible how a failed placement, disconnected data, or morning exit can return a person to the beginning while staff repeat the same coordination work.
4 stakeholder lenses + public context
7 stages with success and failure paths
5 operational gaps → 3 findings
4 opportunity hypotheses with constraints
The service looked linear. The evidence described a daily loop.
01
Seek help
Phone, walk-in, or outreach
02
Share needs
Identity and support needs
03
Wait
Hold, call back, keep trying
04
Receive referral
A bed is offered
05
Travel
Reach the site
06
Stay
Use the placement
07
Exit
Leave or restart
No bed is found, or the referral disappears while the person travels.
The placement is unsuitable, or morning exit starts another search.
A failed placement or morning exit returns the journey to Seek help.
Wait
Availability is incomplete or already stale
Referral
The handoff is not confirmed end to end
Restart
Needs and history do not travel with the person
Context — a capacity crisis also creates a coordination problem
Toronto's shelter system is constrained first by demand and available beds. A service map cannot design more capacity into existence. It can, however, show why reaching an available and suitable placement still requires people and staff to reconstruct the same information across calls, organizations, and shifts.
I framed the work around one question: where does a shelter request stop behaving like one continuous service? That shifted the focus from a single intake channel to the end-to-end experience—from seeking help through referral, travel, stay, and morning exit, then down through the operation supporting each stage.
What forces a person or staff member to reconstruct the journey from the beginning?
One urgent need moves through five partial views of the service
One continuous, time-sensitive need
Phone, walk-in, and outreach carry the client journey.
Calls, email, and local system views carry the coordination.
No shared operational record closes the loop across organizations.
Evidence — preserve four perspectives without flattening them
I organized the material through four lenses: a person seeking shelter, outreach, shelter operations, and city oversight. For every lens, I extracted steps, failures, workarounds, systems, and desired outcomes, then attached each observation to an actor and journey stage.
Three codes—access, data and communication, and human toll—made repeated patterns visible without removing their context. A bed taken before arrival, for example, is simultaneously a failed client handoff, a frontline coordination burden, and evidence of delayed availability and missing referral confirmation.
Four partial views converge into three system findings
Steps, uncertainty, repeated disclosure
Access work and local workarounds
Referral, fit, and frontline coordination
Capacity, accountability, and planning
Synthesis layer
21 observations located by actor and journey stage
Each observation keeps its source perspective, moment, consequence, and workaround.
01
Access
A person cannot reliably see or secure an appropriate bed.
02
Coordination
Availability, referral status, and client needs move separately.
03
Human toll
People and staff repeat work while time and trust erode.
Record a step, failure, workaround, system, or desired outcome.
Attach it to the actor and stage where it occurs.
Mark access, data/communication, or human consequence.
Trace repeated observations to an operational gap.
Journey — the last stage reconnects to the first
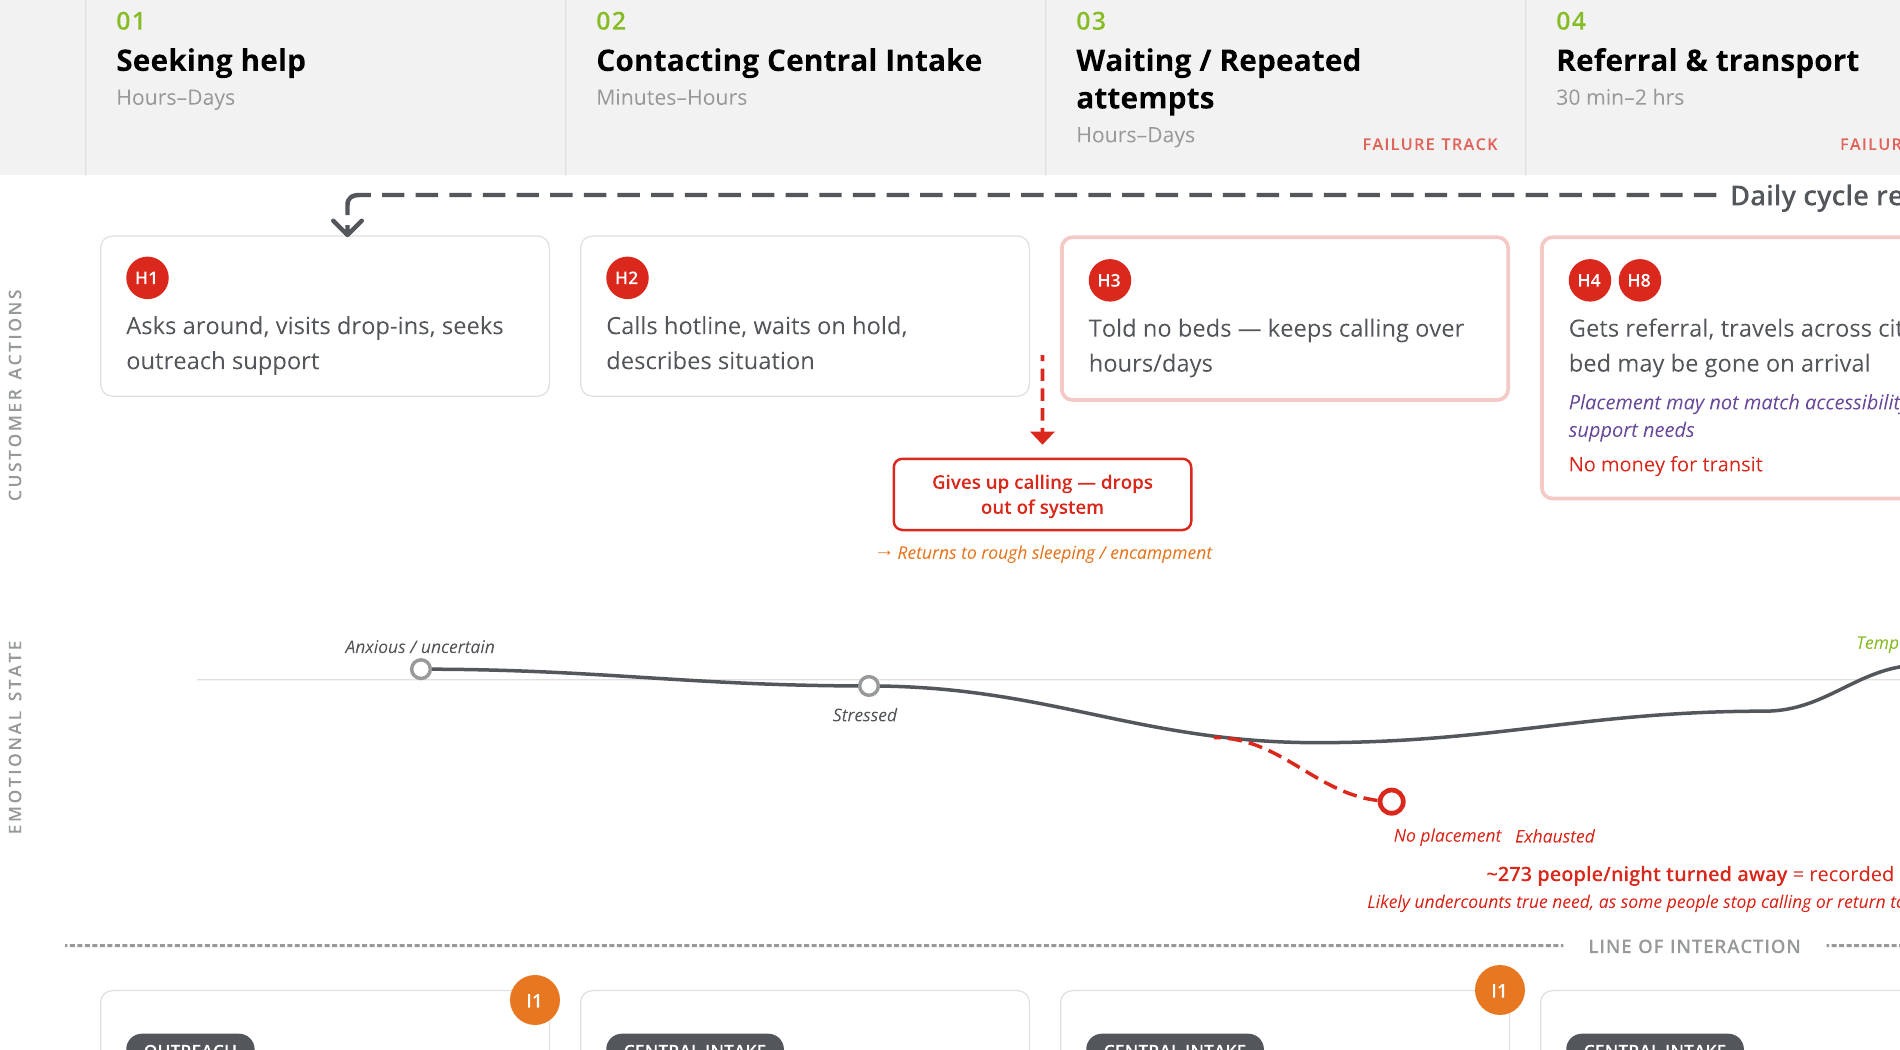
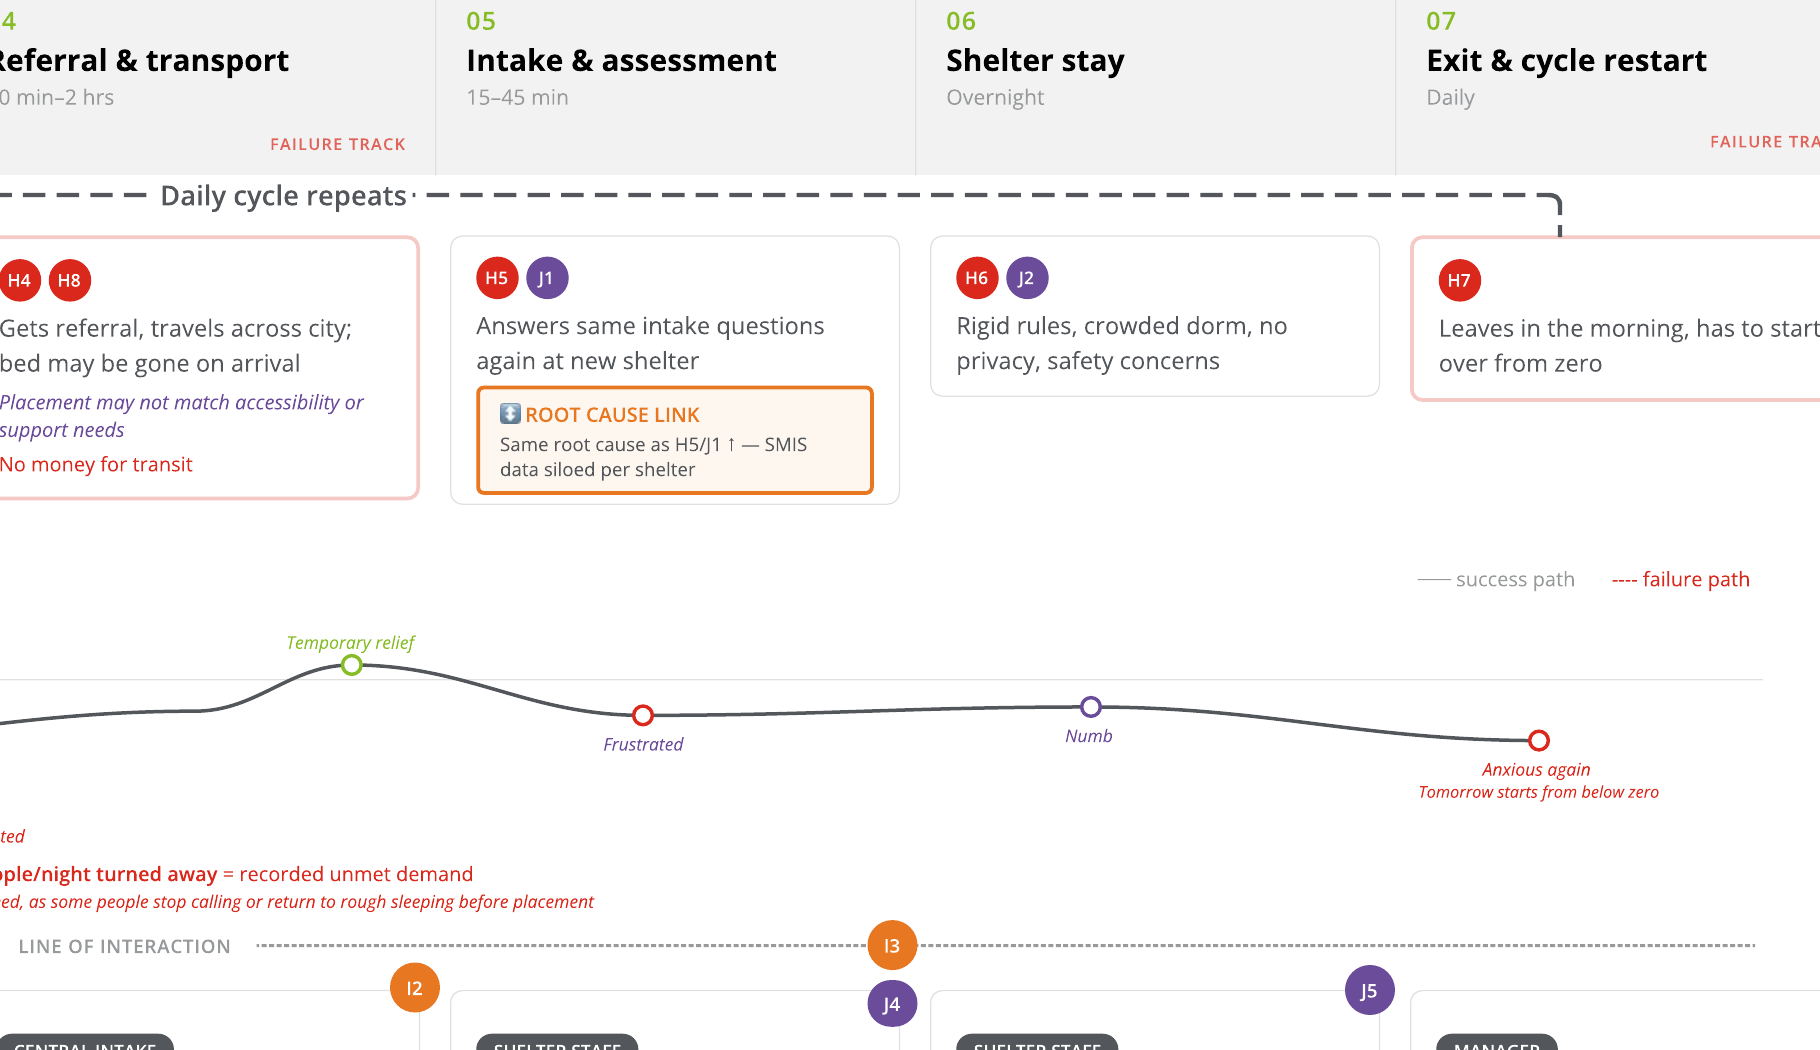
A tidy left-to-right journey would imply that intake ends in a stable stay. The evidence described a repeating loop: calls may not lead to a bed, referrals can fail before arrival, and a morning exit can trigger another search that same day. I made this restart the dominant structure rather than a footnote.
The focused views below divide the artifact at the referral handoff. They keep the stage detail and emotional arc legible on screen while preserving the relationship between early uncertainty and the later return to intake.
Repeated calls and uncertain referrals appear before a person ever reaches a bed.
A failed referral or morning exit reconnects the final stage to the first.
Operations — human effort bridges the missing infrastructure
Below the line of visibility, staff check local views, call other sites, re-enter information, and respond to failed arrivals. Those actions keep the service moving, but they also reveal that capacity, referral status, and client needs do not travel as one shared operational record.
Staff compensate for incomplete visibility through calls, local checks, and repeated intake.
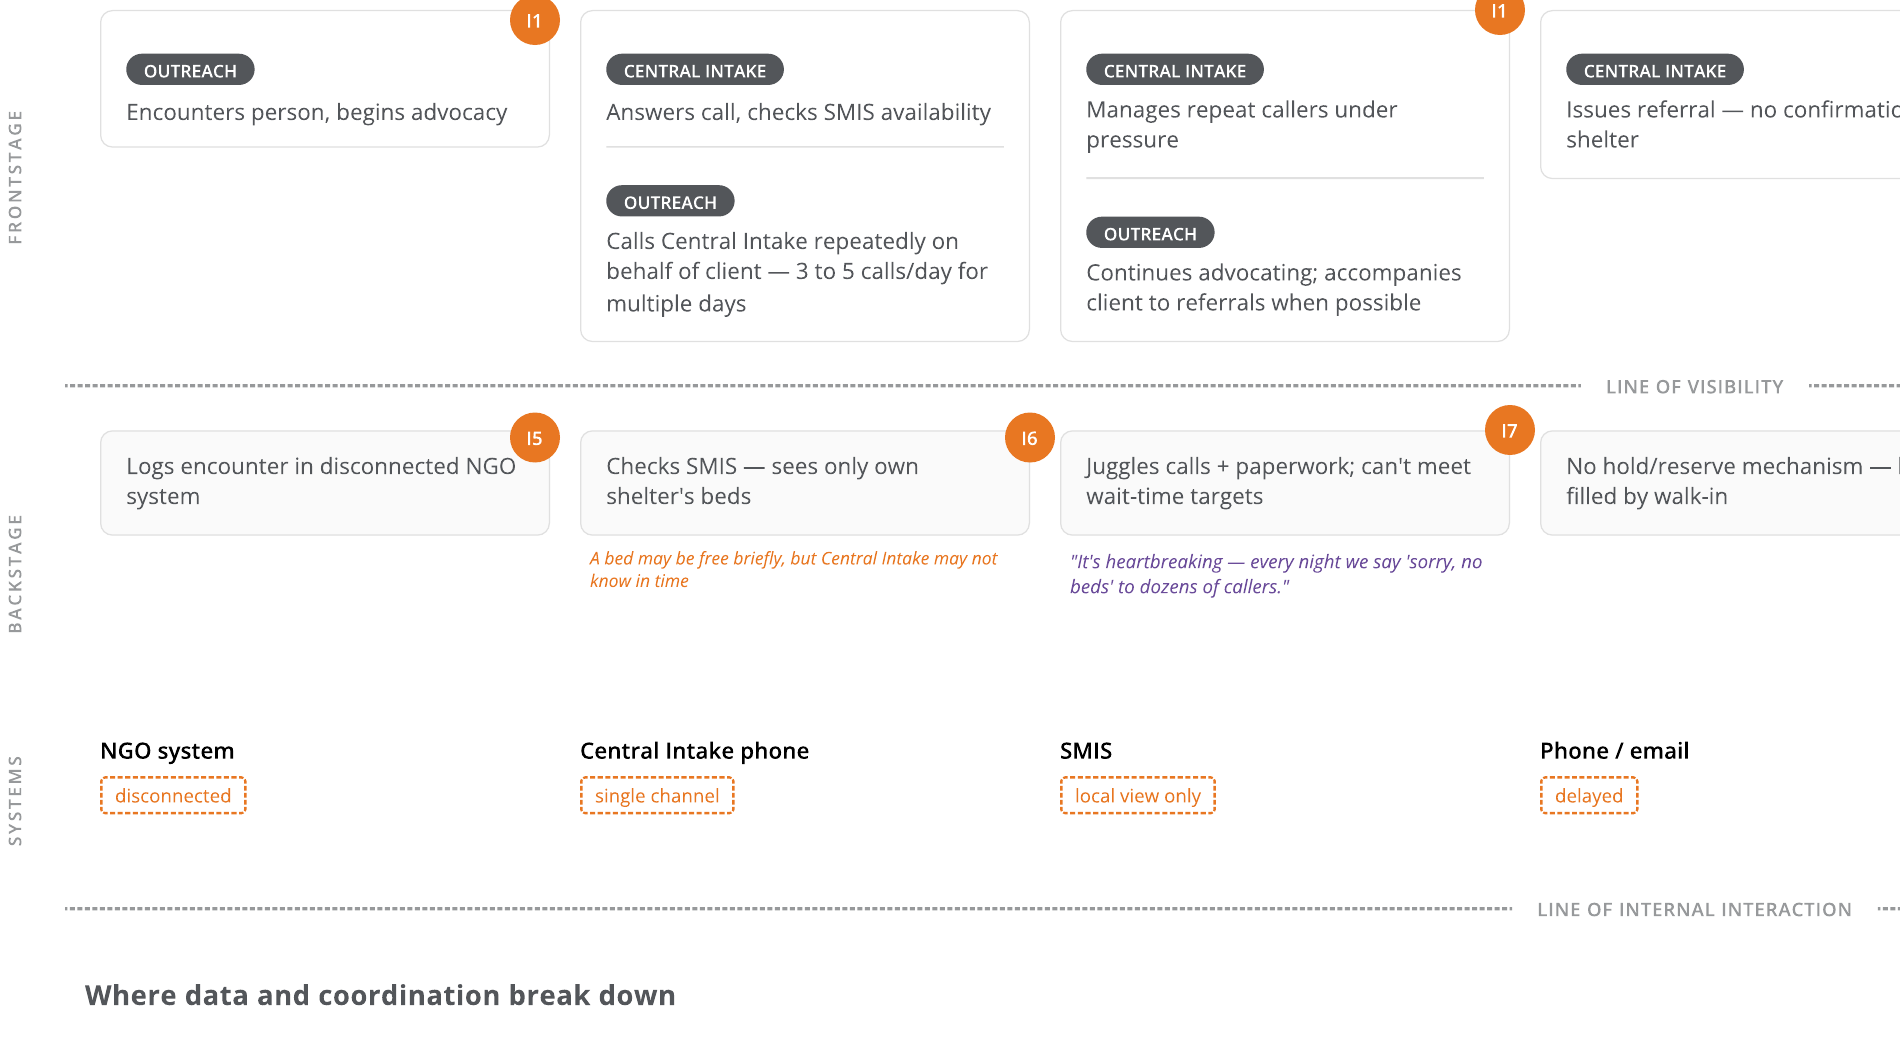
The referral handoff has no shared confirmation or portable client record.
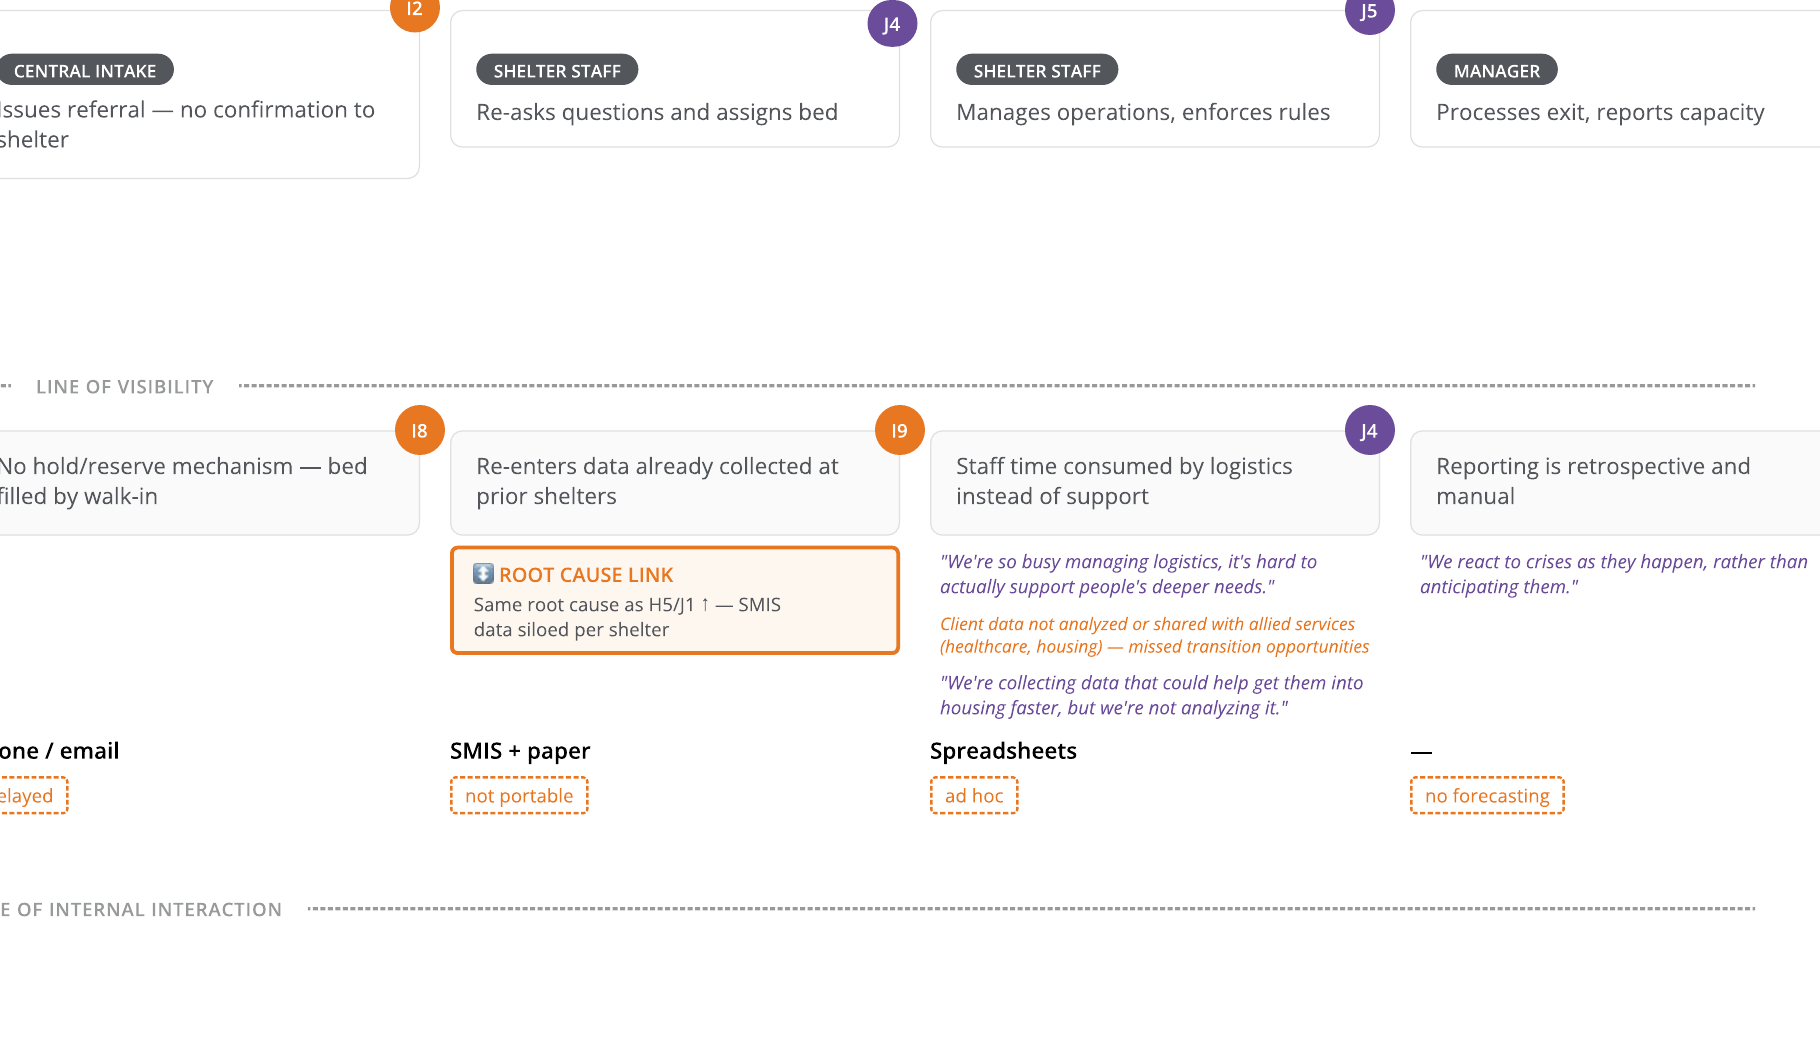
Five gaps explain three recurring consequences
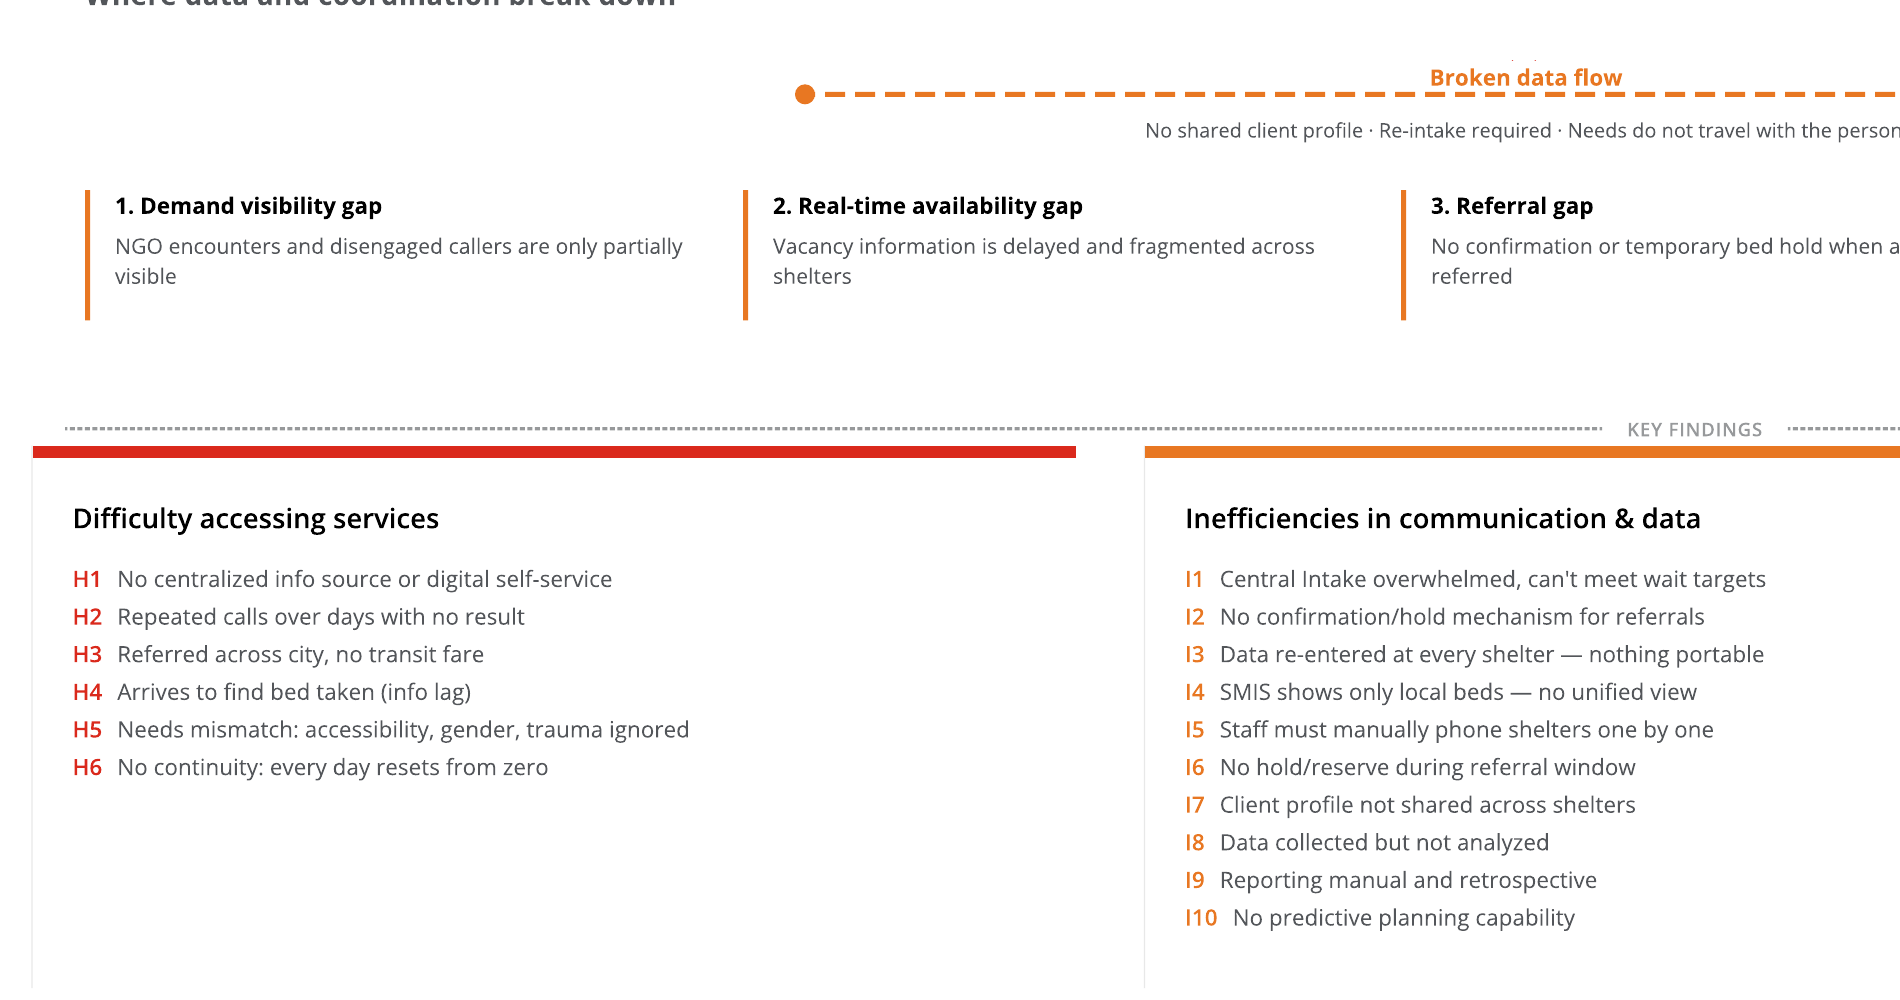
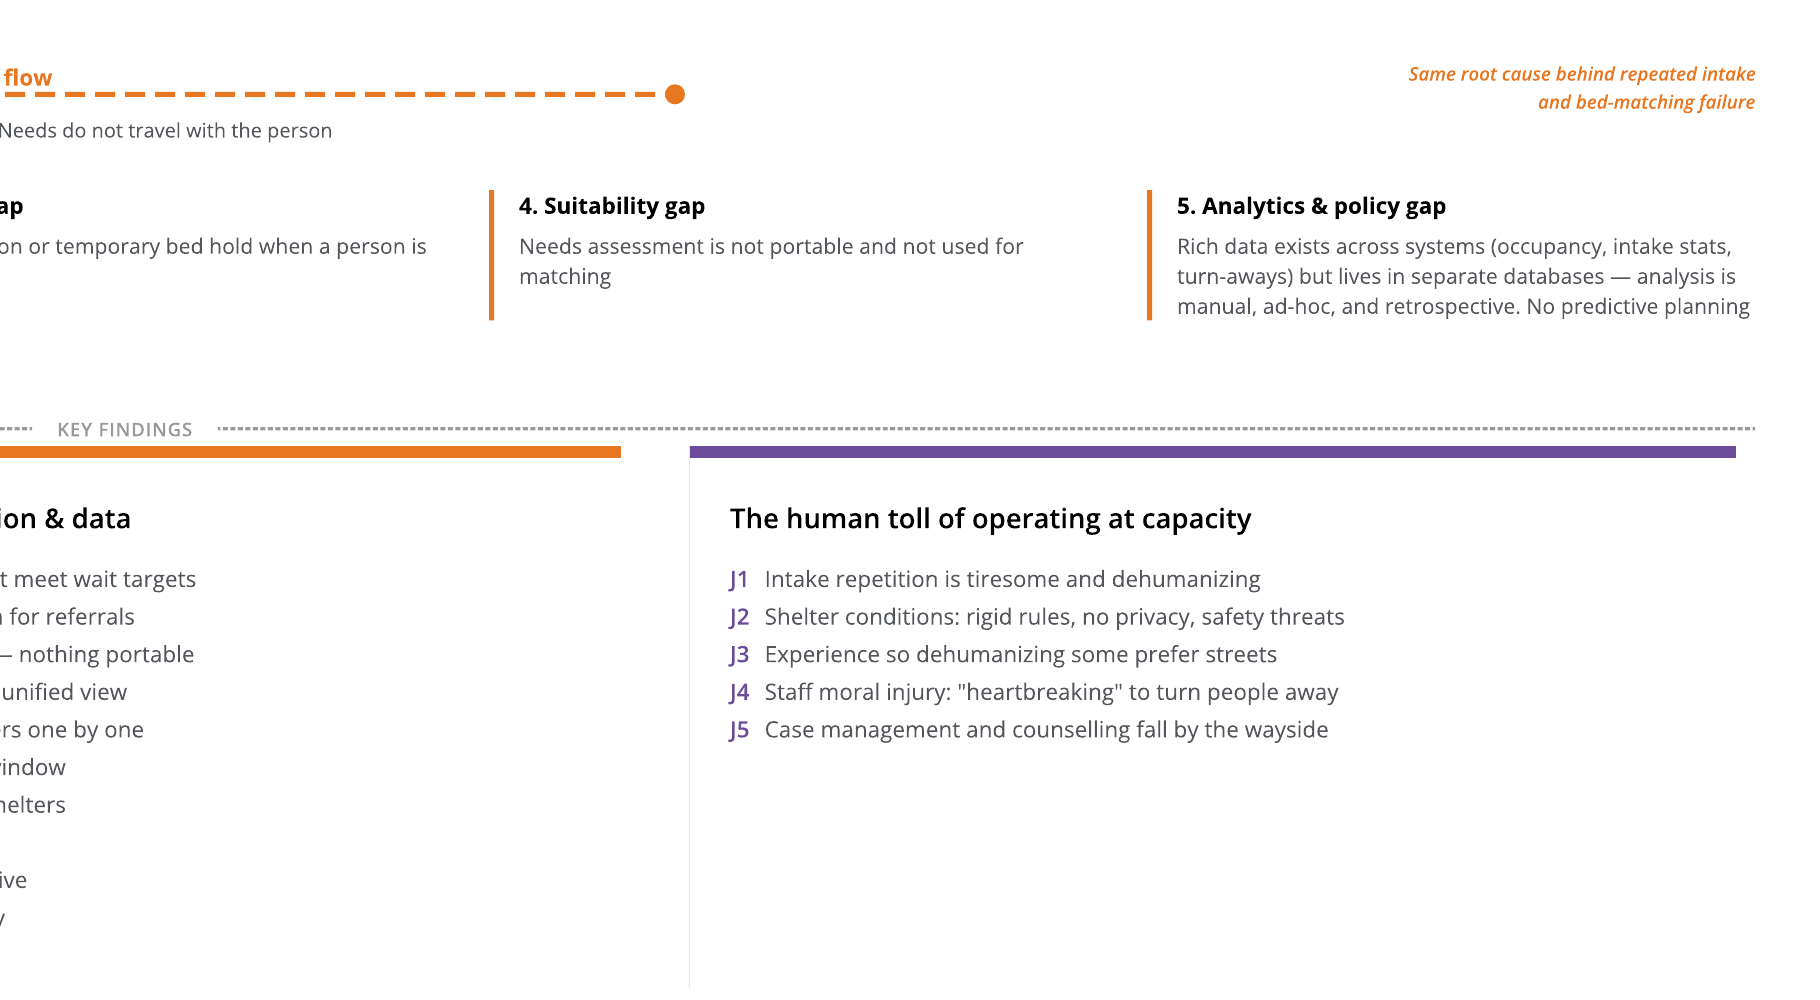
Demand visibility, live availability, referral confirmation, suitability matching, and analytics connect the isolated moments into one diagnosis. Together they produce information-blind access, repeated intake and coordination, and a human toll shared by people seeking shelter and the staff supporting them.
Demand visibility, availability, and referral confirmation drive the earliest breakdowns.
Suitability and data continuity connect placement failures to the daily restart.
Direction — start with the failure, not the technology
I translated the diagnosis into four opportunity areas, each beginning with a visible breakdown. This keeps a portable profile tied to repeated disclosure, live availability tied to failed referrals, forecasting tied to reactive planning, and multi-channel access tied to phone dependency.
01
Live availability + referral confirmation
Failed referral
Confirm capacity and preserve the handoff during travel.
02
Portable client profile
Repeated disclosure
Carry needs and consented information across service touchpoints.
03
Demand and capacity forecasting
Reactive planning
See recurring pressure earlier without treating prediction as placement.
04
Multi-channel access
Phone dependency
Add accessible paths while keeping human help available.
The value of the blueprint is not that it prescribes a final service. It makes the argument inspectable: a reader can move from a human consequence to the handoff, data gap, or operating rule beneath it, then see which hypotheses would need validation.
Next — validate the map with the people living and operating the service
The next phase would use trauma-informed research with shelter users, contextual inquiry with Central Intake, outreach, and shelter staff, plus privacy and accessibility review. I would rehearse referral confirmation across organizations before testing any automation or new access channel.
This independent study synthesizes public reporting and scenario-based stakeholder material. It did not include direct field research or implementation; the opportunity directions remain hypotheses.
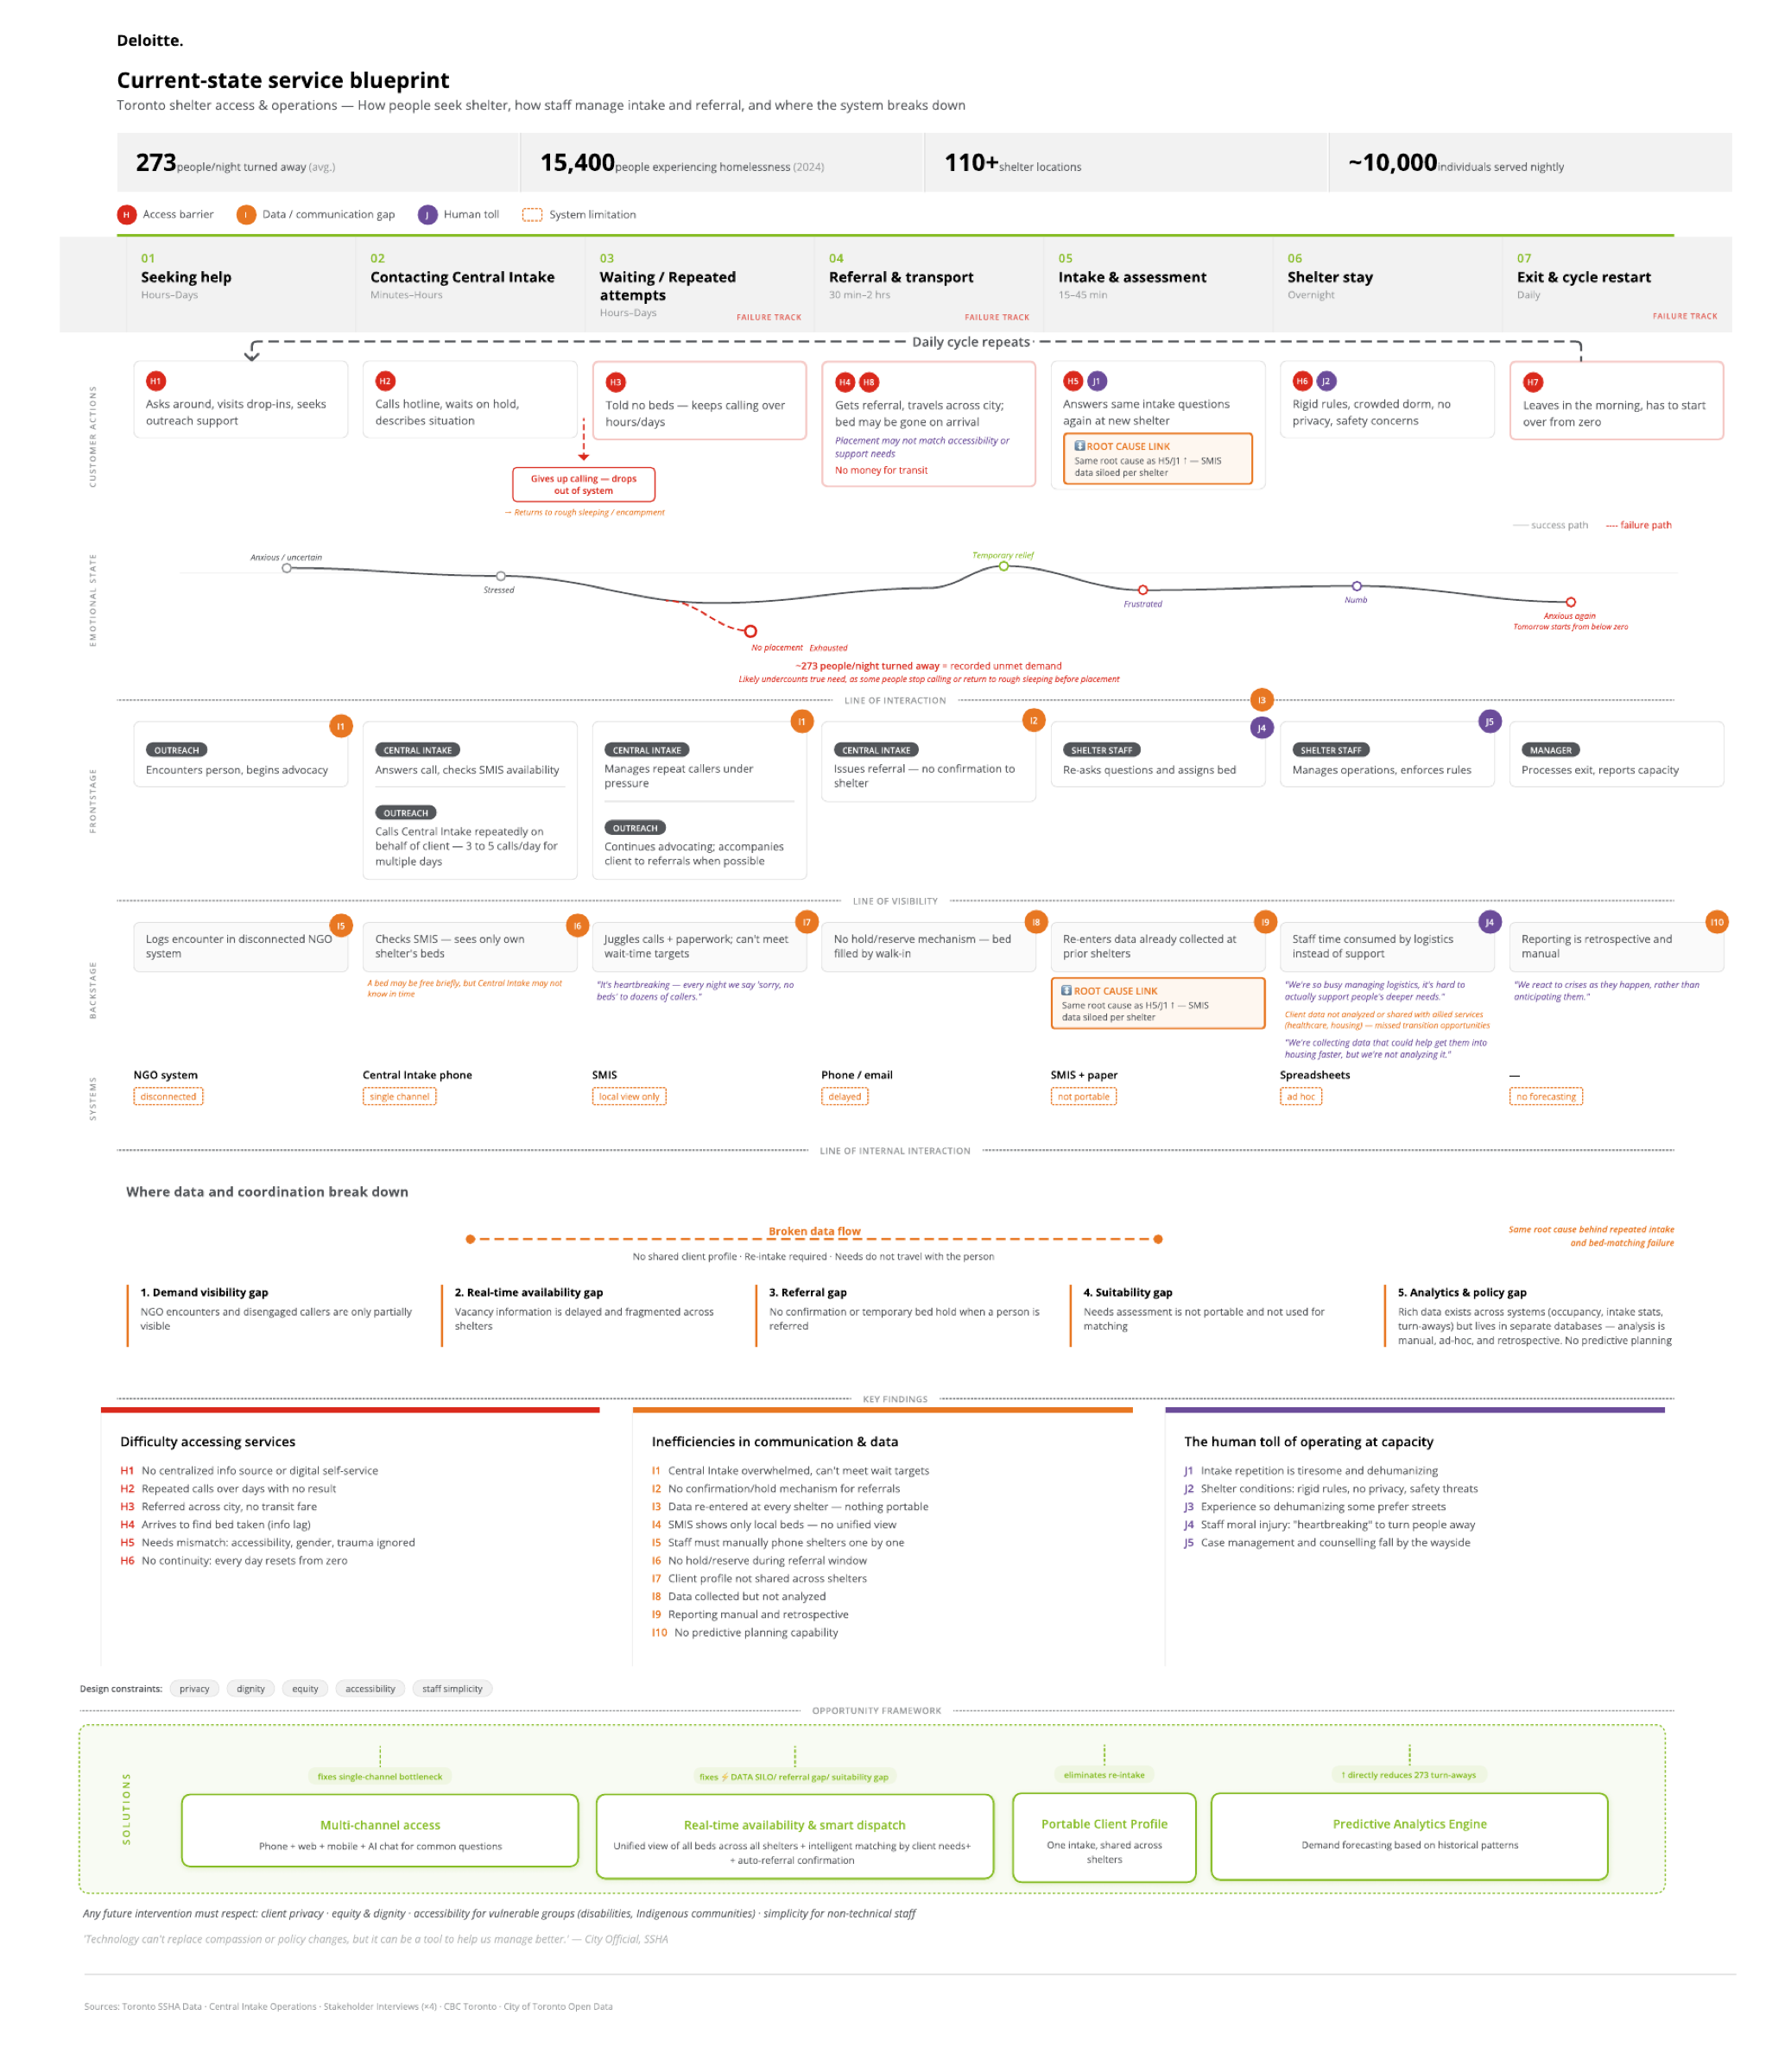
Inspect the full current-state blueprint
The full map is intentionally secondary to the focused story above.
 Open full resolution ↗